If you’re not big on reading and just want to see pretty pictures, go here first. If it looks interesting, read on.
It’s no secret to those who know me that I have a great love of Target. My criteria for places to live includes a “30 minutes from Target” clause, henceforth known as 30MFT. I also happen to think that interactive maps are cool. These two seemingly unrelated facts provided a golden opportunity: figure out how to make cool, interactive maps AND discover what parts of the country I am eliminating with 30MFT.
This was the perfect project to try out D3.js, a javascript library that mixes SVG, HTML, and CSS. D3 has been used to make countless infographics, such as the ever popular choropleth map and I wanted to give it a try.

Here’s how the process went for creating this highly useful infographic:
Step 1: Download (or link to) D3 and jquery. Easy, right?
Step 2: Create a basic html template to hold all the forthcoming javascript goodness, with a side of CSS.
Step 3: Read a couple tutorials on getting started with D3 (see links below), get acquainted with the power of d3.select and d3.selectAll, type a few lines of code, and see a beautiful purple circle on your screen. Ok, so maybe your circle isn’t purple and maybe it’s not even a circle, but the point is that you get something to appear on screen, nicely wrapped in SVG tags.
Step 4: Think to yourself, this is going to be a piece of cake. Now to find a map.
Step 5: Do a little research and find out that you need something called GeoJSON or TopoJSON to harness the true power of interactive maps in D3. Also learn a little about different mapping projections. This reading is as thrilling as it sounds. Also discover that you have a massive amount of geographic data at your disposal thanks to Natural Earth.
Step 6: Download some maps, follow directions in tutorials, refresh the browser and marvel at your spectacular blank screen. Right around here is where you realize how wrong you were at step #4. I should disclose that I am no programming expert and this stuff is probably much easier to those with more skill than I have. But alas, I am stubborn and after therapeutically banging my head against the wall, I tried again, failed again, then realized I had typed “d3.geo.albersUSA” instead of “d3.geo.albersUsa” for my map projection. Damn you, CAPS LOCK.
Step 7: Refresh the browser and pray to the coding gods. OH MY GOD THERE’S A MAP (all is forgiven, CAPS LOCK). Commence happy dance.

Step 8: Your joy fades as you realize that while you now have a map, it’s not exactly interactive. In fact, it doesn’t even have any points on it. It’s time to find some data to plot.
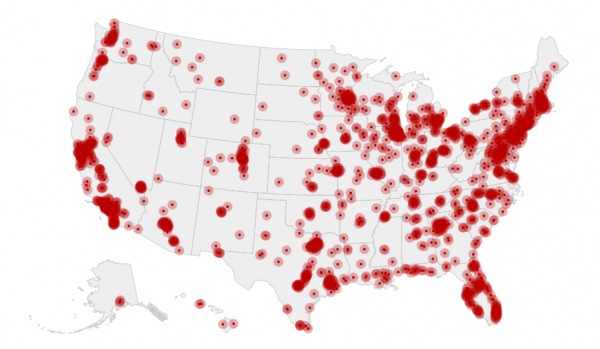
I pulled addresses for Target stores from the corporate website and put them in a spreadsheet so I could get rid of extra information (like the phone number). Then I used the batch geocoder at www.findlatitudeandlongitude.com to convert store addresses into latitude and longitude.
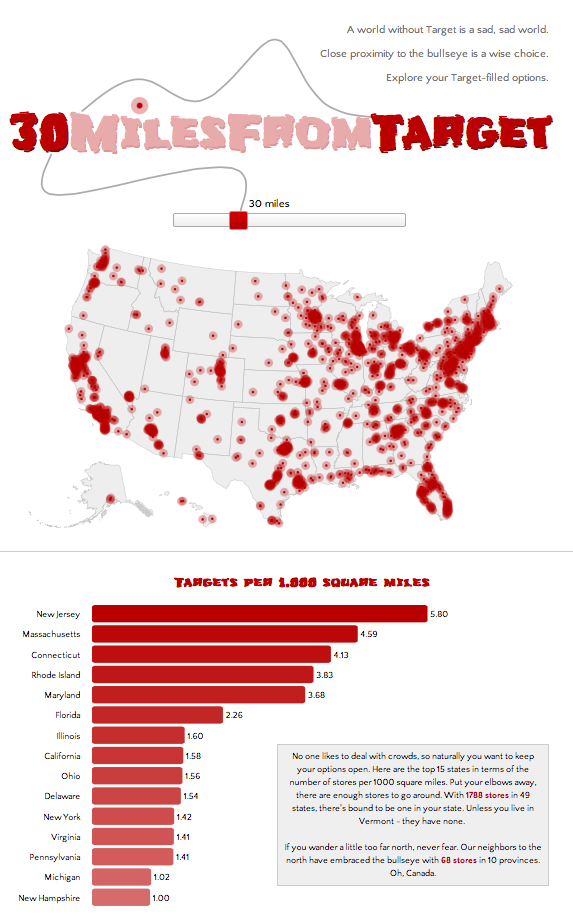
This is where D3 starts to get really cool – all you have to do is pass in latitude and longitude values and D3 will plot them in the correct location based on your selected projection (albersUsa in my case). And voilà, 1788 dots on a U.S. map.
Step 9: Time to make the map interactive by adding a slider and tying the value of the slider to the radius of each data point with a little jquery.
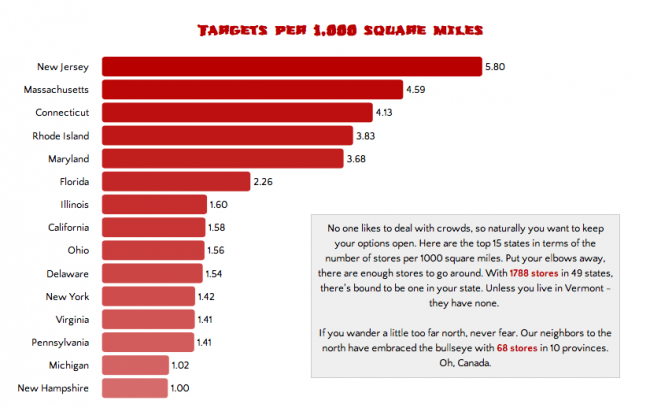
Step 10: At this point I was getting the hang of D3 so I added a bar graph using some geographic data. Using D3 to determine the size of the bars and the position of the labels made this chart a breeze to create.
Step 11: Add some decorative SVG lines and play with D3’s path generator, which makes it easy to define points and control the type of curve from point to point.
Step 12: Add some text and futz over the details. No one else may care about the exact color of the drop shadow, but I do.
Some final notes:
- D3 is awesome, as is Target.
- The dots on Alaska are not to scale. Frankly, I don’t care.
- Vermont is the one sad state without a Target. All is not lost for Vermont – New York, New Hampshire, and Massachusetts pick up the slack and make at least the edges of Vermont within 30MFT territory.
Extremely helpful sites:
See the full infographic here.
Recent Comments