Overview
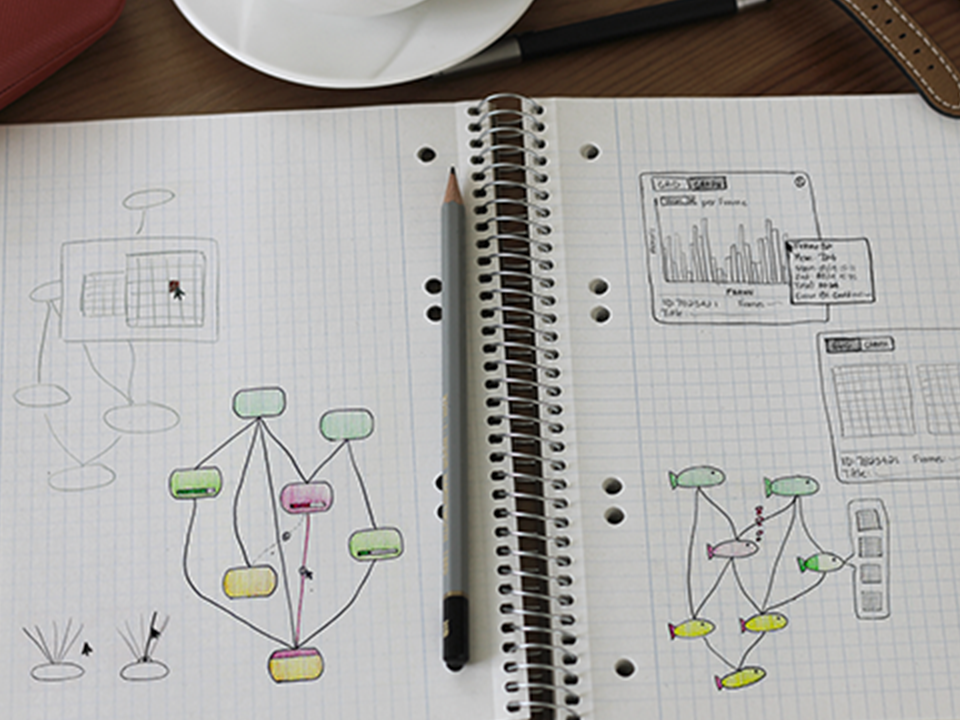
As artists and animators work on a new project, they send their work to a render farm that outputs the final frames (with lighting, textures, etc.). The rendering process can take a long time, and a single problem can stall the entire render. Current node graphs give little indication of the render progress or where problems occurred.
For this project I was asked to brainstorm ideas for viewing information in a render queue that allows people to easily monitor the progress of each render and, most importantly, quickly identify problems.
Considerations
Because each render is composed of many different pieces, there were a number of complications to consider.
Outcome
After interviewing and observing animators who use the render queue, I identified three main areas of improvement, starting out broad and getting increasingly specific:
Making the queue easy to scan
The first step was to think about ways to make it easier to see the status of each node at a glance.
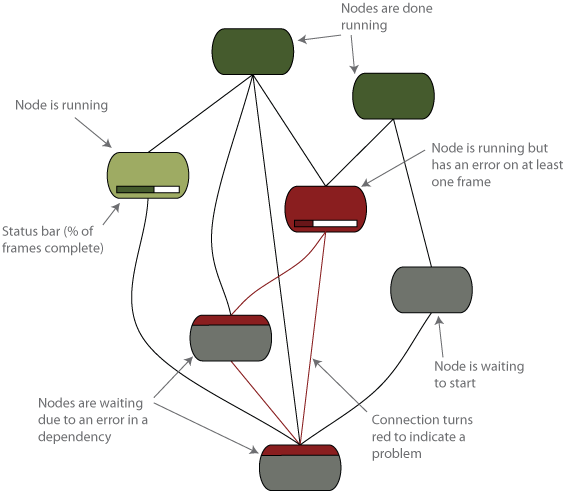
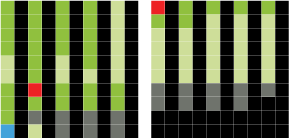
Color-coding
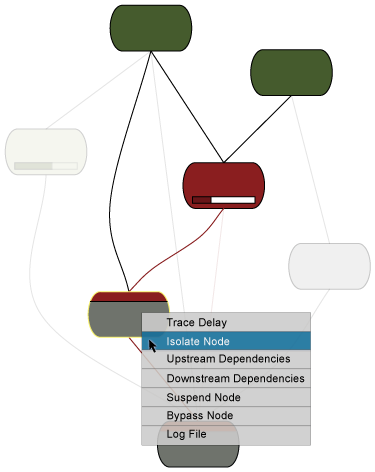
Simple color-coding goes a long way. Dark green nodes are complete with no problems, light green nodes are in progress with no problems, red nodes have at least one error, and gray nodes are patiently waiting for their turn.
Upstream error indicator
If a node can’t be rendered because of an upstream error, the top of the node and the path to the node turns red. Once the upstream error is corrected, the node will be able to finish.
Frame by frame progress
A progress bar shows how many frames within a running node have been rendered.
Troubleshooting the queue
Another improvement was to make it easier to identify the source of a problem.
Show dependencies
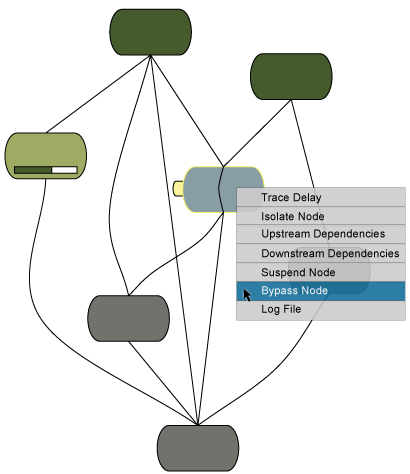
Choose any node and highlight upstream or downstream dependencies.
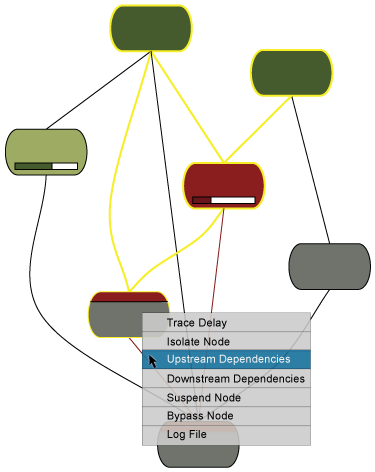
Isolate a node
Isolate a problem node to view only the nodes related to it.
Bypass a node
If a node is causing problems, bypass it to let the render finish.
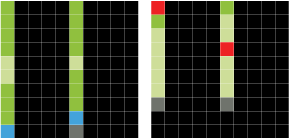
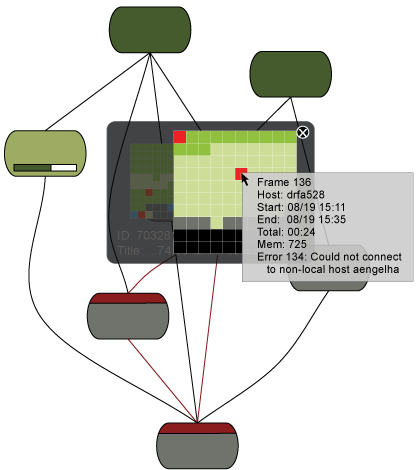
Monitoring individual frames
If a node is holding up a render, the next step is to determine which frames are involved. After trying a number of options, I chose to represent each frame as a cube, grouped in a 10 x 10 matrix (100 frames).
Advantages of the cube design
Easy to parse: Grouping information into smaller chunks make it easier for the brain to process (think phone numbers, social security numbers, etc.).
Color-coding: Just like the node graph, each frame can be color-coded based on its status.
Expandable: Nodes that consist of more than 100 frames can have as many 10 x 10 cubes as needed.
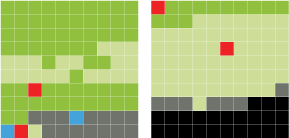
Pattern recognition: It is a common animation practice to render only certain frames for test renders. This is referred to as “rendering on 2s” for every other frame, “rendering on 3s” for every third frame, etc. A matrix design makes it easy to see these rendering patterns.
Rendering on 2s
Rendering on 3s
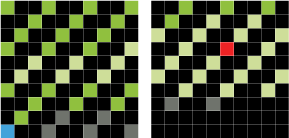
Rendering on 5s